|
Exercise 3.3 |
Finally, compute the poverty headcount for the whole of Cameroon and
for each of its two regions using as poverty lines
- a national absolute threshold of 373 F CFA;
- the national relative threshold;
- the relative thresholds for each of the two regions.
Check whether using an estimate of the national relative threshold
(as opposed to a known or deterministic national relative
threshold) has an impact on the standard error of the national headcount. |
|
Answer |
|
a- |
|
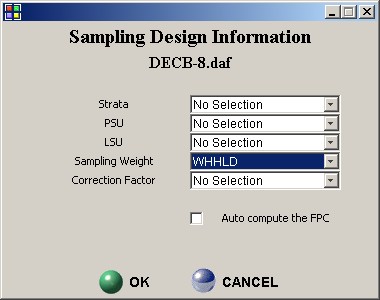
STEP 1:
Initialising the sampling weight: EDIT|Set
Sample Design |
|
|
|
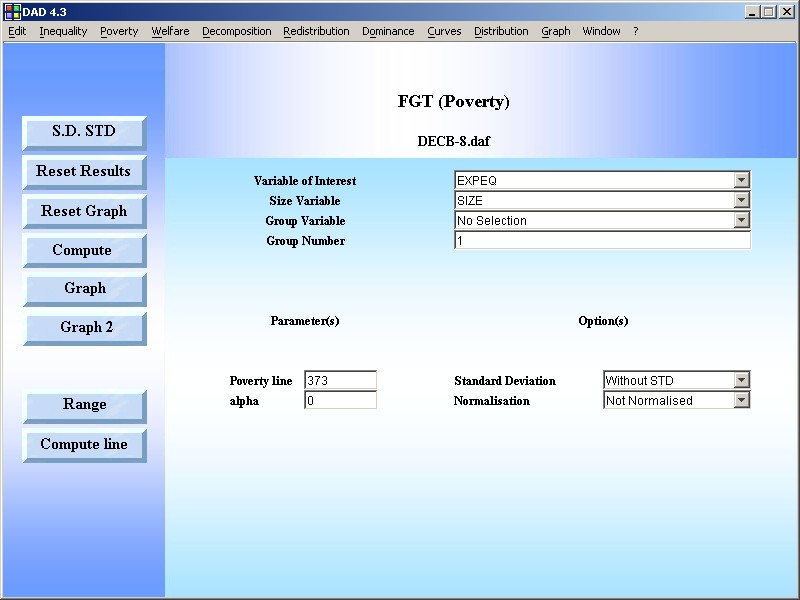
STEP
2: Use the DAD Application:
POVERY|FGT Index |
|
RESULTS |
Version:0.9 StartHTML:-1 EndHTML:-1 StartFragment:0000000111 EndFragment:0000007136
FGT (Poverty)
| Session Date |
Thu Jul 08 12:38:29 EDT 2004 |
| Execution Time |
0.281 sec |
| FileName |
DECB-8.daf |
| OBS |
1000 |
| Sampling Weight |
WHHLD |
| Variable of interest |
EXPEQ |
| Size variable |
SIZE |
| Group variable |
No Selection |
| Group Number |
1 |
| Option |
Normalised = NO |
| Parameter |
α=0 |
Index |
Estimated value |
Standard deviation |
Lower bound |
Upper bound |
Confidence Level in (%) |
FGT |
0,47318047 |
0,02658057 |
0,42108351 |
0,52527744 |
95,00000000 |
Poverty line |
373,00000000 |
0,00000000 |
373,00000000 |
373,00000000 |
95,00000000 |
EDE |
0,00000000 |
0,00000000 |
0,00000000 |
0,00000000 |
95,00000000 |
|
|
b & c |
|
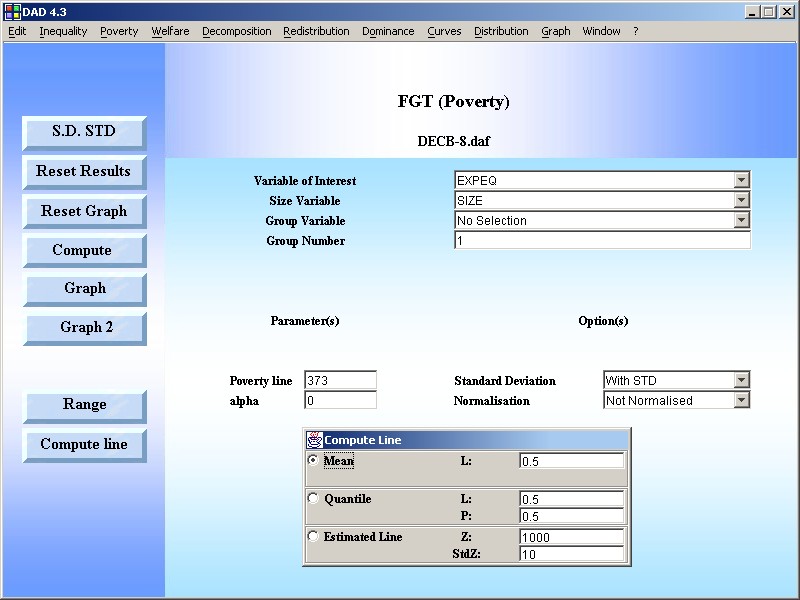
Use the DAD Application: POVERY|FGT
Index & Click on button Compute line |
|
FGT (Poverty)
| Session Date |
Thu Jul 08 12:39:12 EDT 2004 |
| Execution Time |
0.031 sec |
| FileName |
DECB-8.daf |
| OBS |
1000 |
| Sampling Weight |
WHHLD |
| Variable of interest |
EXPEQ |
| Size variable |
SIZE |
| Group variable |
No Selection |
| Group Number |
1 |
| Option |
Normalised = NO |
| Parameter |
α=0 |
Index |
Estimated value |
Standard deviation |
Lower bound |
Upper bound |
Confidence Level in (%) |
FGT |
0,25351133 |
0,02481451 |
0,20487578 |
0,30214687 |
95,00000000 |
Poverty line |
281,69351196 |
10,07623567 |
261,94445324 |
301,44257068 |
95,00000000 |
EDE |
0,00000000 |
0,00000000 |
0,00000000 |
0,00000000 |
95,00000000 |
Region 1
FGT (Poverty)
| Session Date |
Mon Jul 05 14:44:58 EDT 2004 |
| Execution Time |
0.0 sec |
| FileName |
DECB-8.daf |
| OBS |
1000 |
| Sampling Weight |
WHHLD |
| Variable of interest |
EXPEQ |
| Size variable |
SIZE |
| Group variable |
REGION |
| Group Number |
1 |
| Option |
Normalised = NO |
| Parameter |
α=0 |
Index |
Estimated value |
Standard deviation |
Lower bound |
Upper bound |
Confidence Level in (%) |
FGT |
0.17487060 |
0.02309173 |
0.12961163 |
0.22012956 |
95.00000000 |
Poverty line |
373.00000000 |
0.00000000 |
373.00000000 |
373.00000000 |
95.00000000 |
EDE |
0.00000000 |
0.00000000 |
0.00000000 |
0.00000000 |
95.00000000 |
FGT (Poverty)
| Session Date |
Mon Jul 05 14:46:43 EDT 2004 |
| Execution Time |
0.031 sec |
| FileName |
DECB-8.daf |
| OBS |
1000 |
| Sampling Weight |
WHHLD |
| Variable of interest |
EXPEQ |
| Size variable |
SIZE |
| Group variable |
REGION |
| Group Number |
1 |
| Option |
Normalised = NO |
| Parameter |
α=0 |
Index |
Estimated value |
Standard deviation |
Lower bound |
Upper bound |
Confidence Level in (%) |
FGT |
0.29011649 |
0.02631053 |
0.23854880 |
0.34168419 |
95.00000000 |
Poverty line |
478.99566650 |
22.93429518 |
434.04527461 |
523.94605840 |
95.00000000 |
EDE |
0.00000000 |
0.00000000 |
0.00000000 |
0.00000000 |
95.00000000 |
Region 2
FGT (Poverty)
| Session Date |
Mon Jul 05 14:47:38 EDT 2004 |
| Execution Time |
0.0 sec |
| FileName |
DECB-8.daf |
| OBS |
1000 |
| Sampling Weight |
WHHLD |
| Variable of interest |
EXPEQ |
| Size variable |
SIZE |
| Group variable |
REGION |
| Group Number |
2 |
Index |
Estimated value |
Standard deviation |
Lower bound |
Upper bound |
Confidence Level in (%) |
FGT |
0.59275490 |
0.03349239 |
0.52711102 |
0.65839878 |
95.00000000 |
Poverty line |
373.00000000 |
0.00000000 |
373.00000000 |
373.00000000 |
95.00000000 |
EDE |
0.00000000 |
0.00000000 |
0.00000000 |
0.00000000 |
95.00000000 |
FGT (Poverty)
| Session Date |
Mon Jul 05 14:48:03 EDT 2004 |
| Execution Time |
0.047 sec |
| FileName |
DECB-8.daf |
| OBS |
1000 |
| Sampling Weight |
WHHLD |
| Variable of interest |
EXPEQ |
| Size variable |
SIZE |
| Group variable |
REGION |
| Group Number |
2 |
Index |
Estimated value |
Standard deviation |
Lower bound |
Upper bound |
Confidence Level in (%) |
FGT |
0.15802449 |
0.02368923 |
0.11159444 |
0.20445454 |
95.00000000 |
Poverty line |
202.60676575 |
7.56610105 |
187.77748041 |
217.43605109 |
95.00000000 |
EDE |
0.00000000 |
0.00000000 |
0.00000000 |
0.00000000 |
95.00000000 |
|