| Exercise 7.1 |
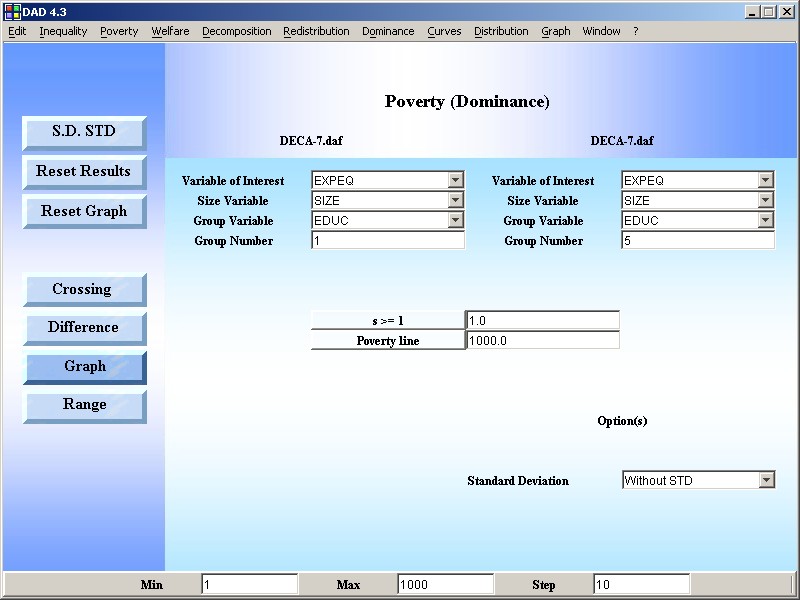
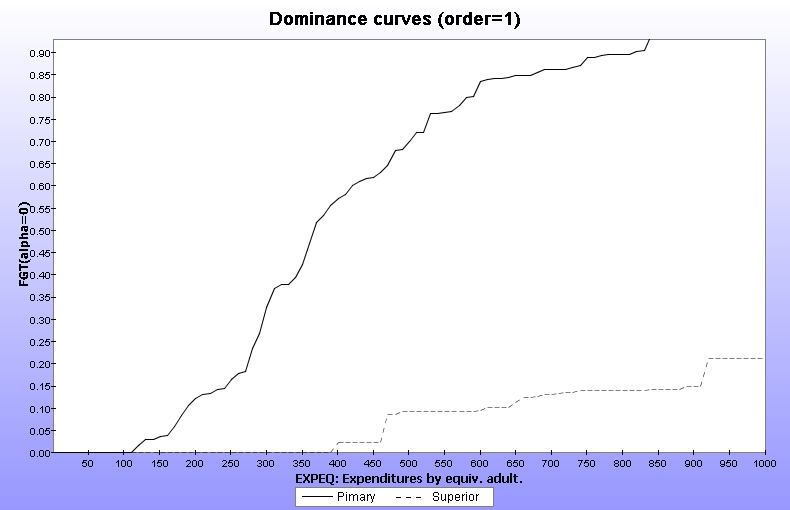
| Using DECA-7, plot the first-order dominance curves separately for those who have a primary level and a superior level of education (see variable EDUC) and for poverty lines varying between 0 and 1000 FCFA What do these curves show? |
|
Answer |
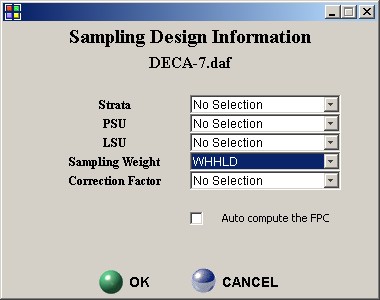
| STEP 1: Initialising the sampling weight: EDIT|Set Sample Design |
|
|
|
STEP 2: Use the DAD Application: DISTRIBUTION|NON PARAMETRIC REGRESSION |
|
RESULTS |
|