| Exercise 7.2 | |||||||||||||||||||||||||||||||||||||||||||||||||||
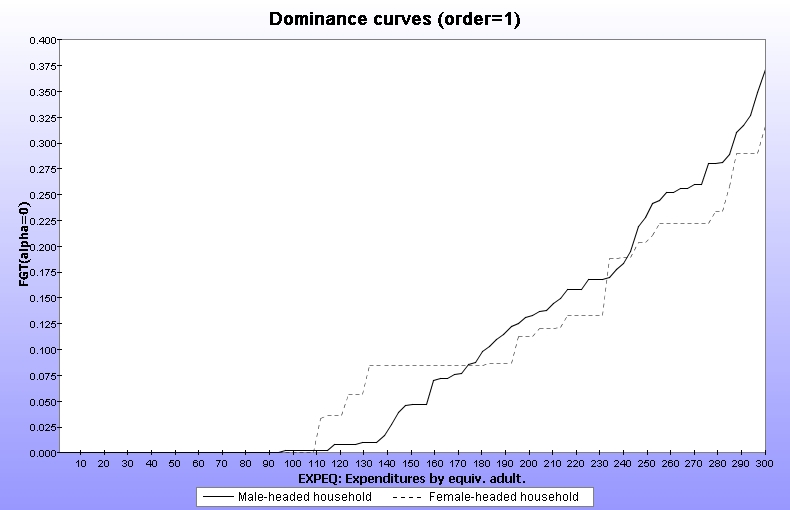
| Using DECA-7, plot the first-order dominance curves separately for the female-headed and for the male-headed households, for poverty lines varying between 0 and 300 FCFA. What do these curves indicate? Find the relevant "critical thresholds" and comment. | |||||||||||||||||||||||||||||||||||||||||||||||||||
|
Answer |
|||||||||||||||||||||||||||||||||||||||||||||||||||
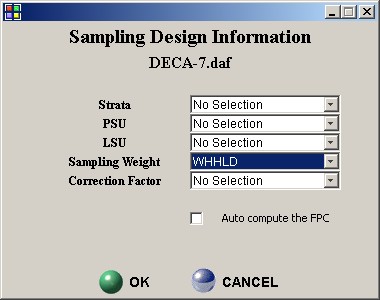
| STEP 1: Initialising the sampling weight: EDIT|Set Sample Design | |||||||||||||||||||||||||||||||||||||||||||||||||||
|
|
|||||||||||||||||||||||||||||||||||||||||||||||||||
|
STEP 2: Use the DAD Application: DISTRIBUTION|NON PARAMETRIC REGRESSION |
|||||||||||||||||||||||||||||||||||||||||||||||||||
|
|||||||||||||||||||||||||||||||||||||||||||||||||||
RESULTS |
|||||||||||||||||||||||||||||||||||||||||||||||||||
 |
|||||||||||||||||||||||||||||||||||||||||||||||||||
|
|||||||||||||||||||||||||||||||||||||||||||||||||||
RESULTS |
|||||||||||||||||||||||||||||||||||||||||||||||||||
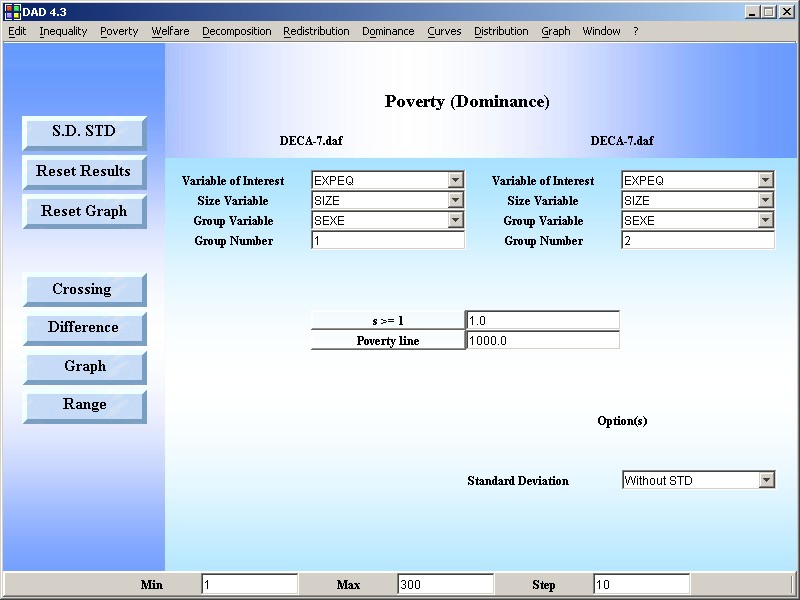
Poverty (Dominance)
|
|||||||||||||||||||||||||||||||||||||||||||||||||||
|