| Exercise 7.6 |
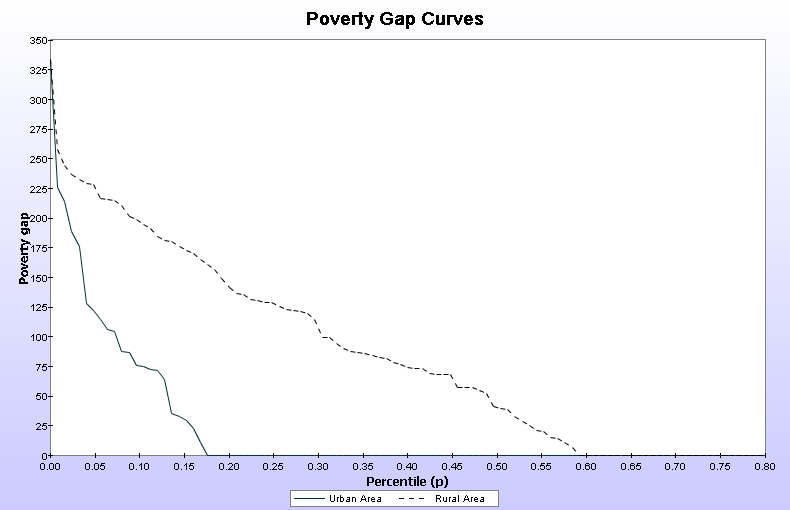
| Using DECB-8, draw poverty gap curves separately for the two groups identified by the variable REGION.. |
|
Answer |
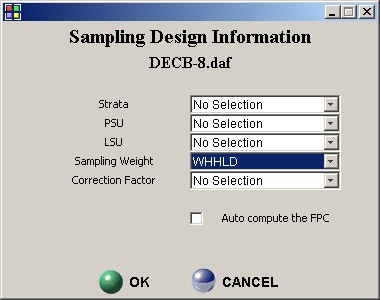
| STEP 1: Initialising the sampling weight: EDIT|Set Sample Design |
|
|
|
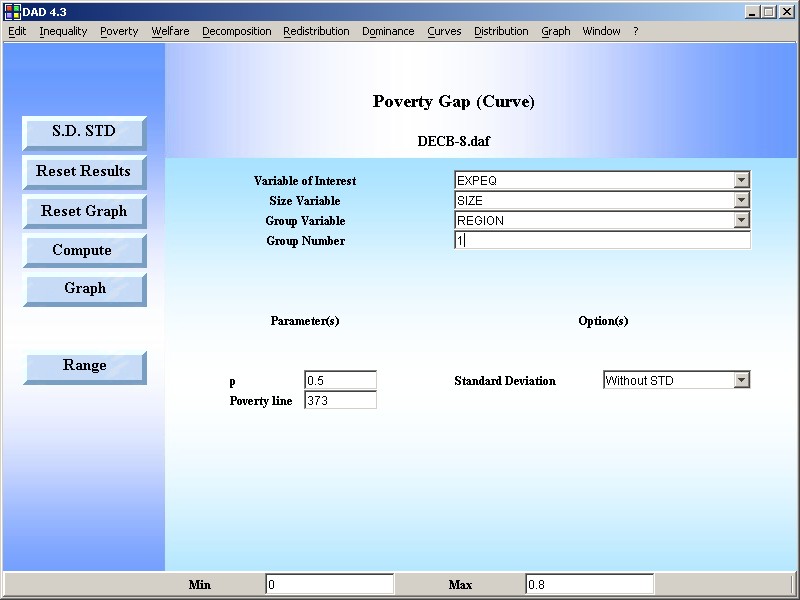
STEP 2: Use the DAD Application: CURVES|Poverty Gap |
|
RESULTS |
|