| Exercise 8.1 |
|
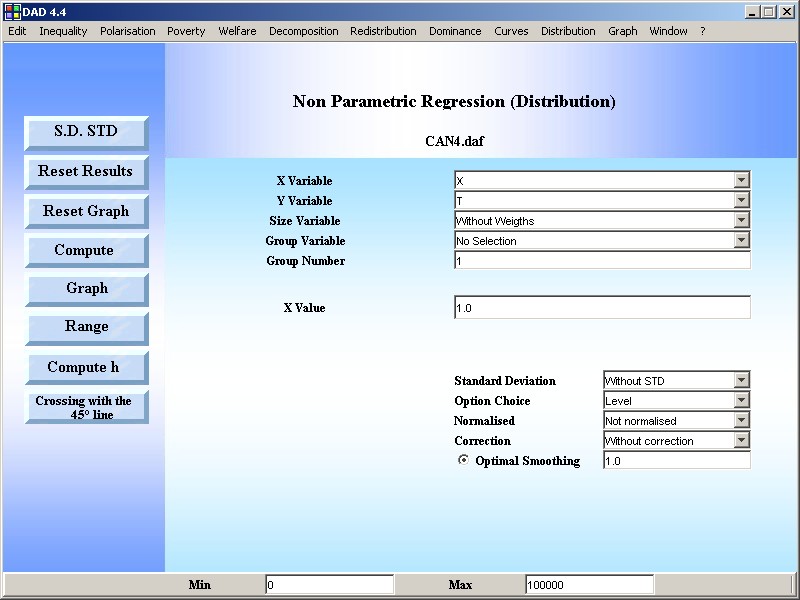
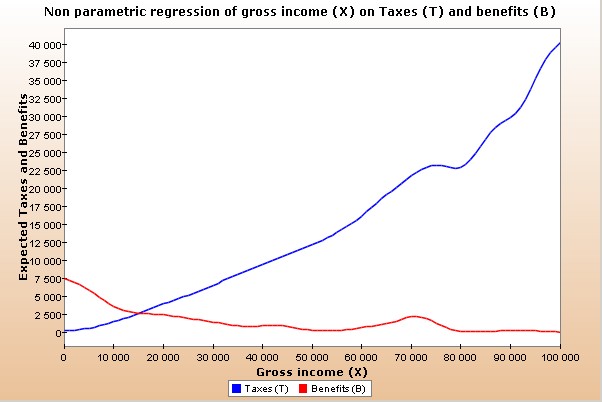
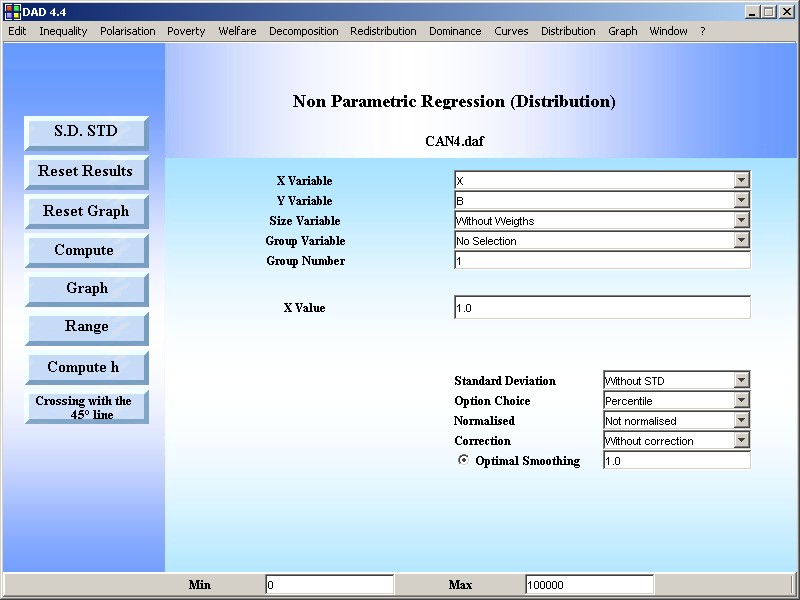
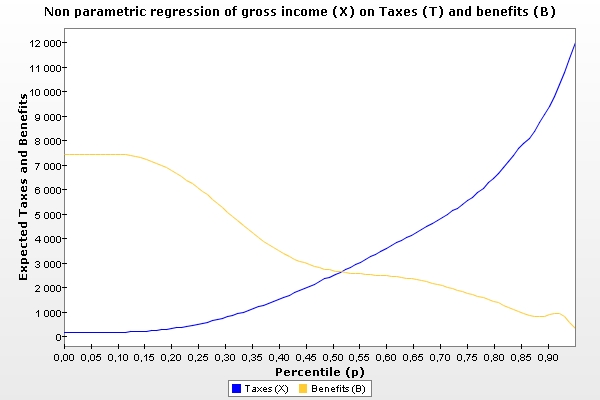
Use the file CAN4 to predict the level of taxes paid and benefits received by individuals at different gross incomes X. For this, use the window "non-parametric regression", and choose alternatively for the X axis the "level" or the "percentile" of gross incomes. What do these regressions indicate? |
|
Answer
|
|
STEP 1: Use the DAD Application: DISTRIBUTION|NON PARAMETRIC REGRESSION |
|
RESULTS |
|