|
Exercise 8.11 |
|
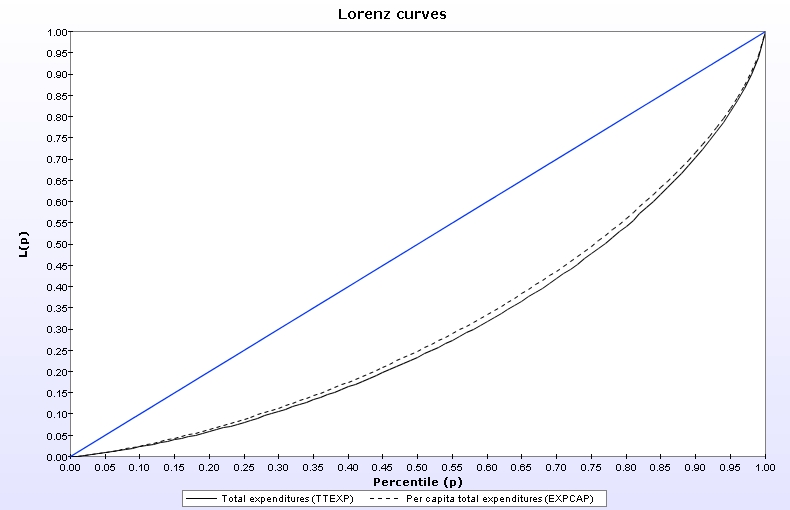
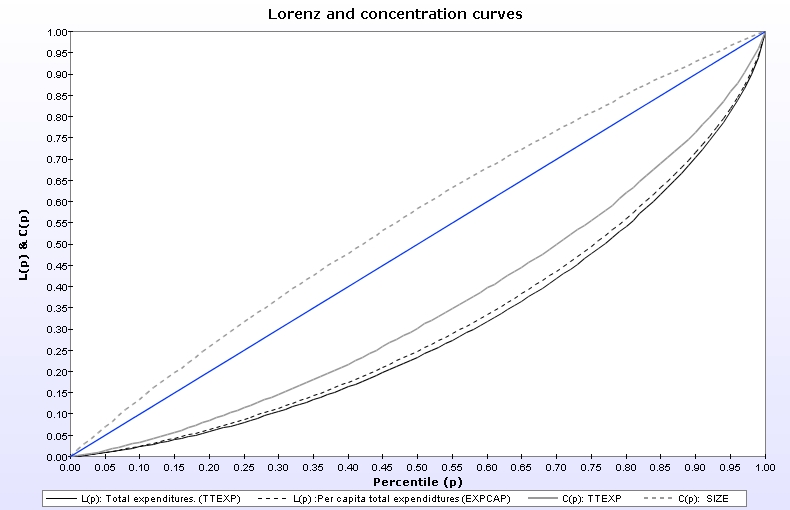
Compare the Lorenz curve of per capita total expenditures (EXPCAP), using
SIZE, and of total expenditures (TTEXP). Which type of expenditures is more equally distributed?
Why?
-
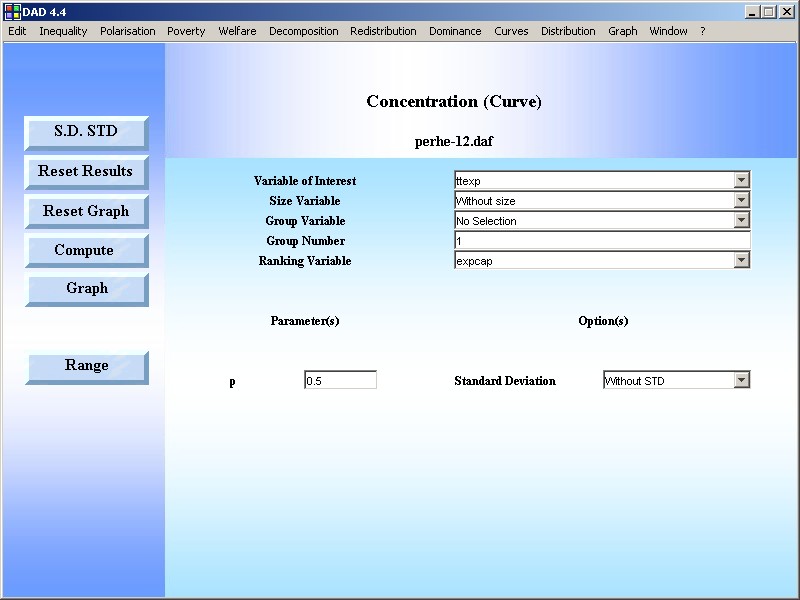
To understand better why, add to the graph a concentration
curve of total expenditures, using per capita expenditures as
the ranking variable, and WHHLD to count observations; this will indicate the concentration of total
expenditures among the poorest households, ranked by per capita expenditures.
-
To complete your understanding, add a concentration curve for household
size, using WHHLD as the aggregating weight and EXPACP as the ranking variable; this will
indicate the concentration of individuals among the poorest households, as ranked by EXPCAP.
Does this help you understand the difference between the above two Lorenz curves?
|
|
Answer |
|
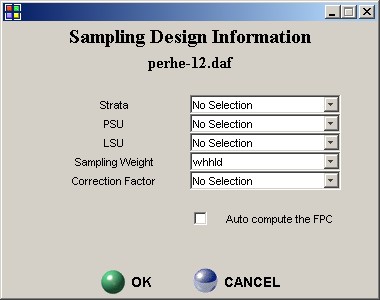
STEP 1:
Initialising the sampling weight: EDIT|Set
Sample Design |
|
|
|
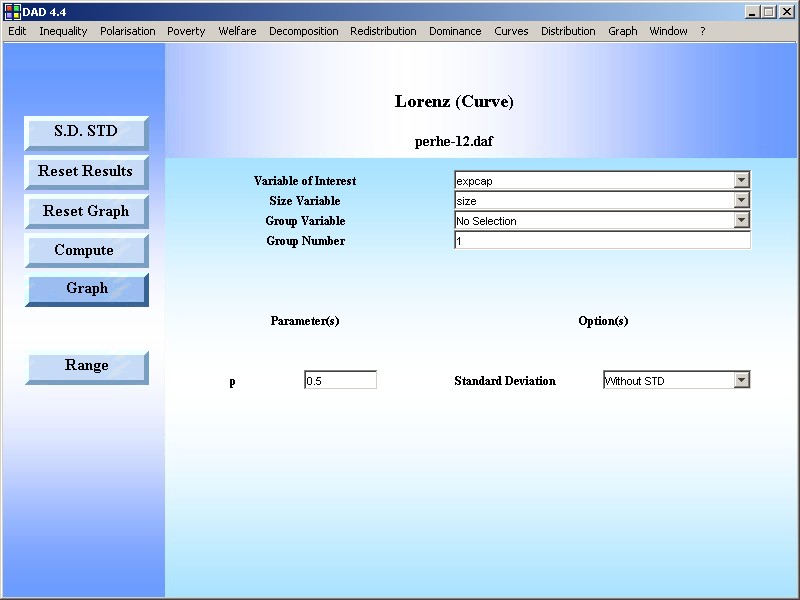
STEP
2: Use the DAD Application:
CURVES|LORENZ CURVE |
|
RESULTS |
|
- Comparing the two Lorenz curves, inequality of total expenditures is
higher than
that of total
expenditures per capita.
|
|
|
|
STEP
1: Use the DAD Application:
CURVES|CONCENTRATION CURVE |
|
RESULTS |
|
| |