| Exercise 8.15 |
|
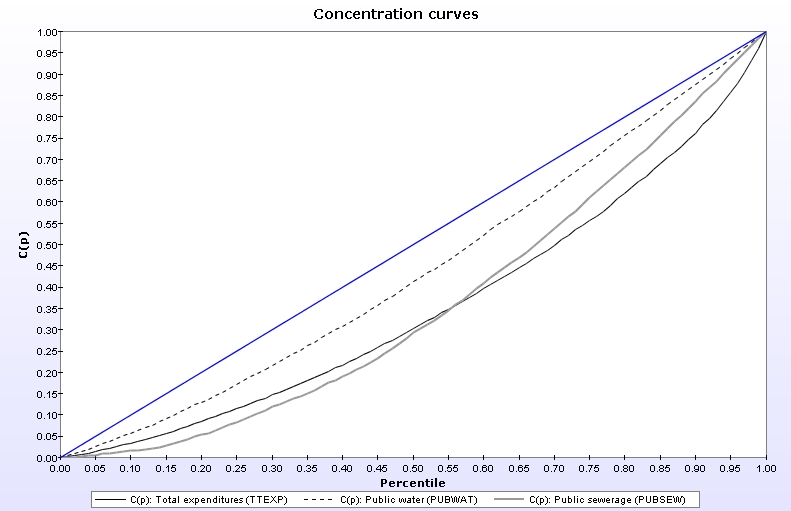
Draw on a new graph the concentration curve of total expenditures (TTEXP) using EXPCAP to rank households. Compare this to the concentration curves for access to piped water (PUBWAT) and to sewerage (PUBSEW), using WHHLD as the aggregating weight to draw the curves and EXPCAP as the ranking variable. That is, find out the concentration of access to piped water and sewerage among various proportions of poorest households, and compare that to their share in total expenditures. What do you find? |
|
Answer |
|
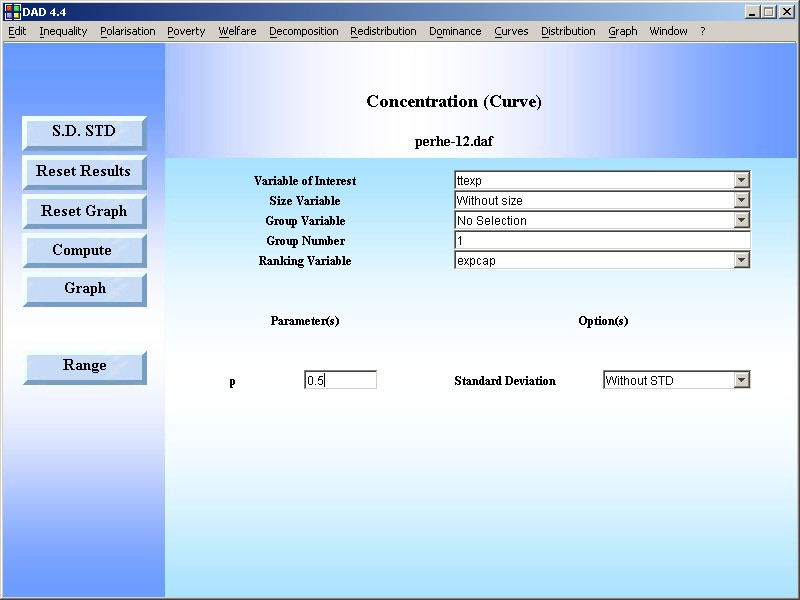
STEP 1: Use the DAD Application: CURVES|CONCENTRATION CURVE |
|
RESULTS |
| |
|