| Exercise 8.18 |
|
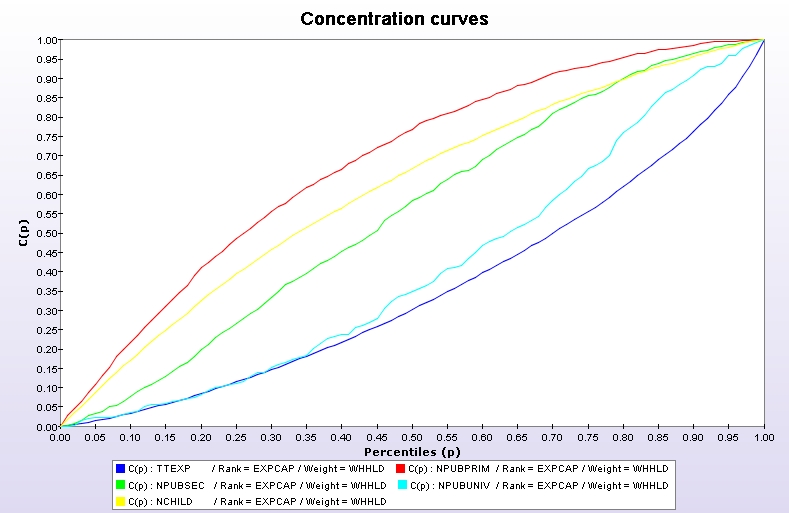
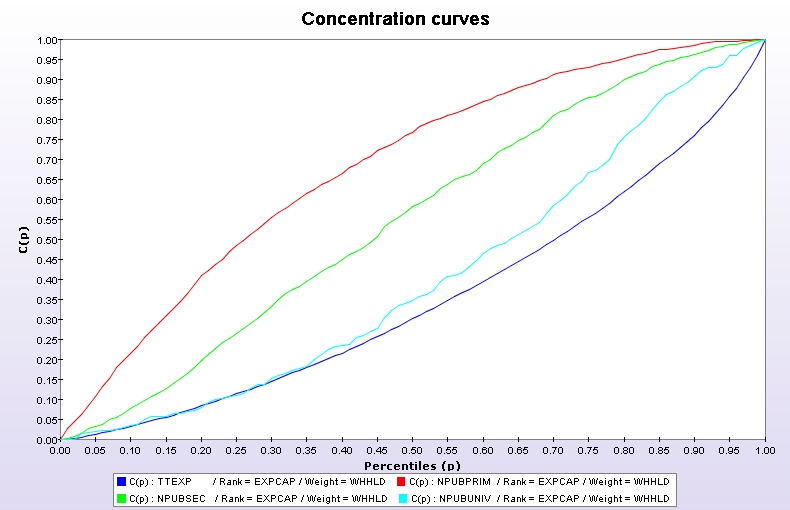
Make a new graph again of the concentration curve of total expenditures TTEXP using WHHLD and EXPCAP to rank households. Compare it to the concentration curve of the number of children at various levels of public education, NPUBPRIM, NPUBSEC and NPUBUNIV using the same aggregating weights. Is education enrolment equitably distributed according to this? What happens to our understanding of the "picture" if we add the concentration curve for the number of children NCHILD? |
|
Answer |
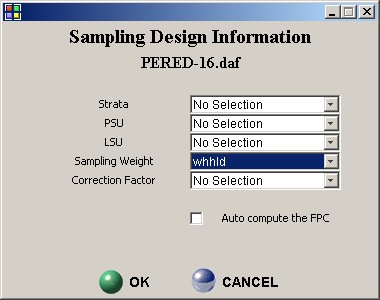
| STEP 1: Initialising the sampling weight: EDIT|Set Sample Design |
|
|
|
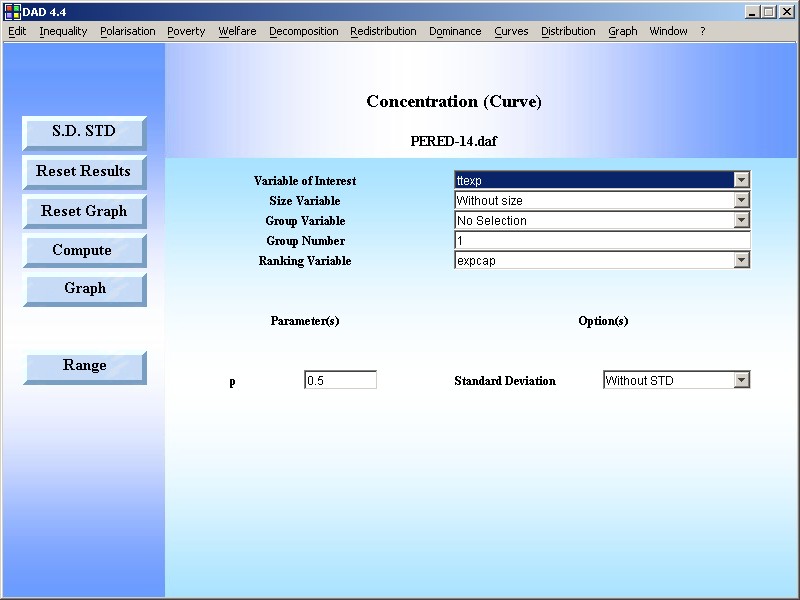
STEP 2: Use the DAD Application: CURVES|CONCENTRATION CURVE |
|
|
RESULTS |
 |
|
RESULTS |
| |