Exercise 8.2

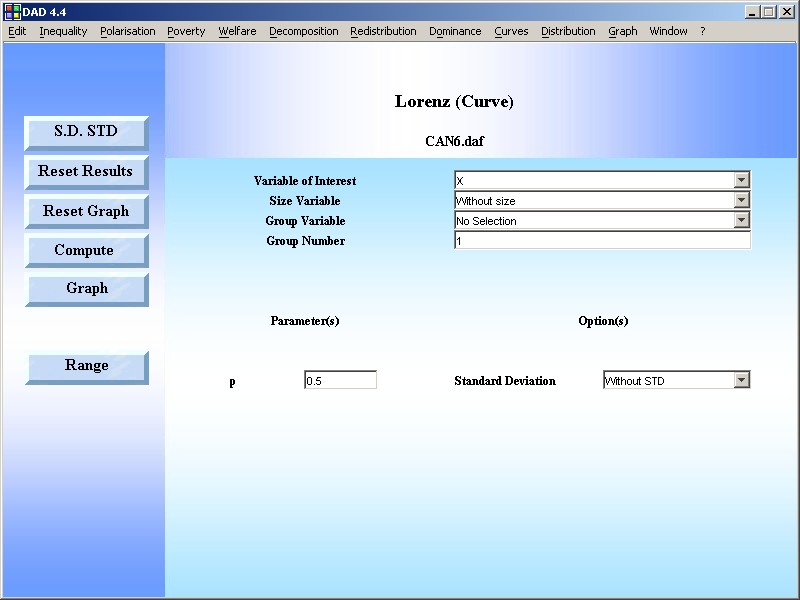
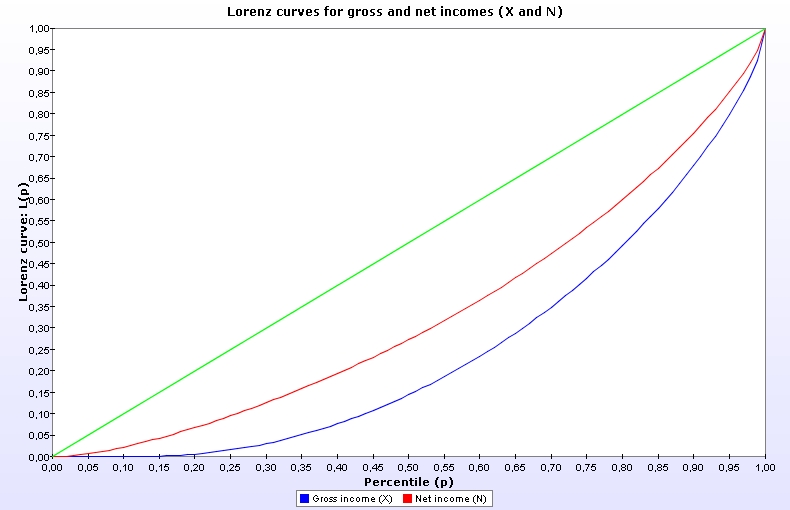
Use the file CAN6 to draw the Lorenz Curve for gross income (X) and net income (N) in 1990 Canada.

  1. What does the difference between the two Lorenz curves indicate?

  2. Then, draw a concentration curve for each of the three transfers B1, B2 et
    B3 and the tax T. What can you say about the TR progressivity and the "equity" of the distribution of the tax and benefits?

  3. Would a proportional increase in the benefit B1 combined with a proportional decrease in B3 of the same absolute magnitude be good for
    inequality, poverty and social welfare?

  4. Would a proportional increase in the benefit B2 financed by a balanced-budget proportional increase in the tax T be good for inequality, poverty and social welfare?.

Answer

(a)

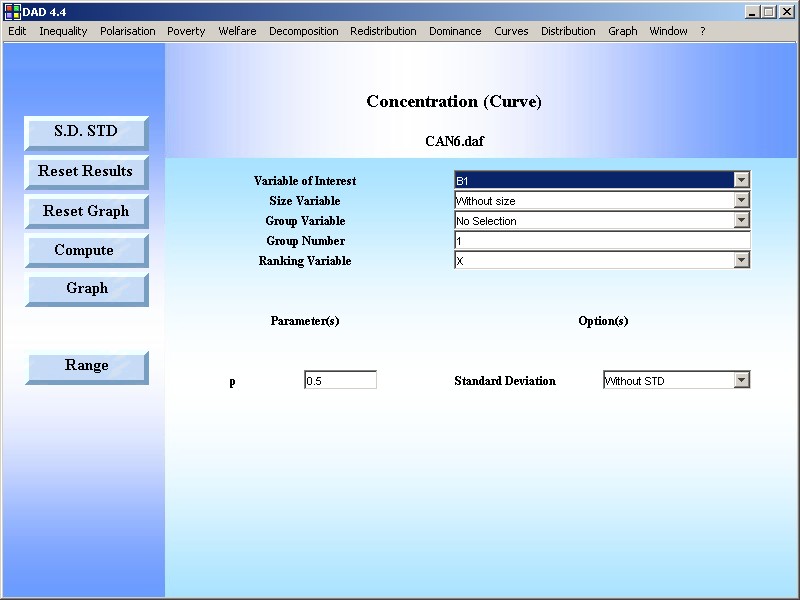
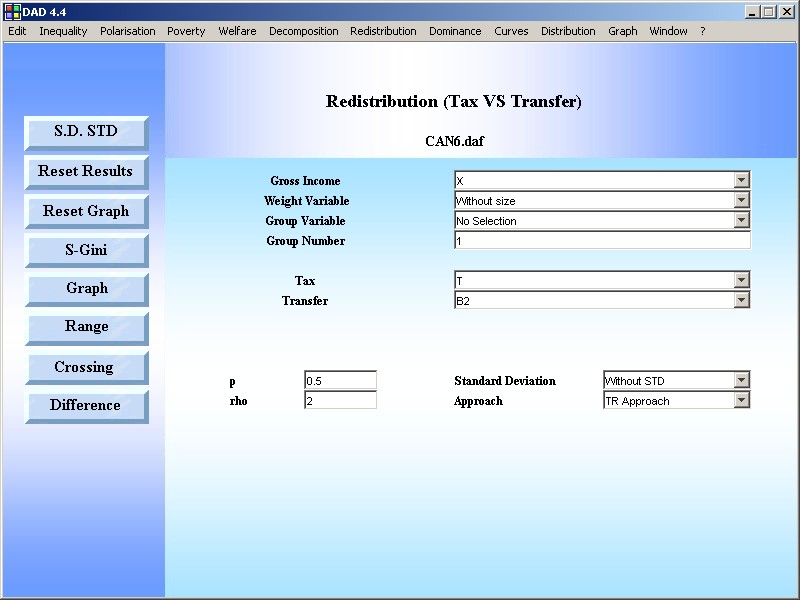
STEP 1: Use the DAD Application: CURVES|LORENZ CURVE
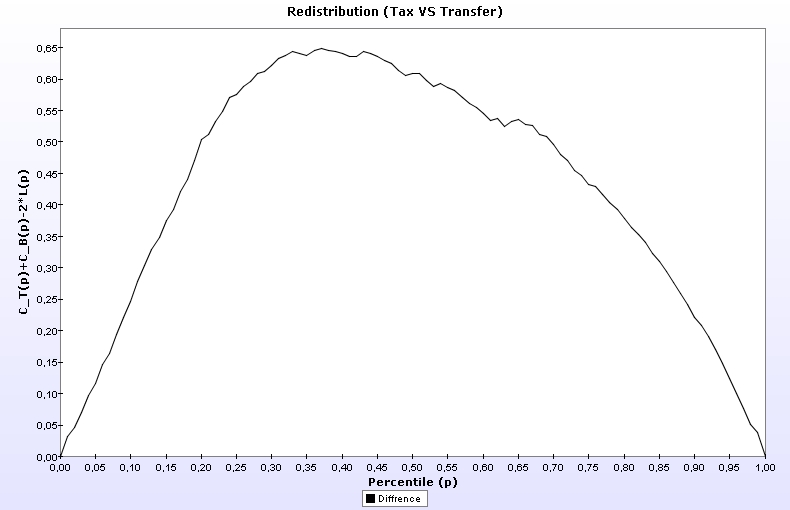
  • After choosing the appropriate variable(s) and parameters, click on the  GRAPH button.

RESULTS


  • Since the Lorenz curve for net income is higher than that for gross income, the redistribution effect has decreased income inequality.


  • b

STEP 1: Use the DAD Application: CURVES|CONCENTRATION CURVE

  • After choosing the appropriate variable(s) and parameters, click on the  GRAPH button.

RESULTS


  • Use the following rule to respond to question (b).


  • c :

Because B3 is more progressive than B1, the impact is regressive and:

  • Inequality & poverty increase,
  • Social welfare decreases.
  • d

We begin by checking if B is more progressive than T.


STEP 1: Use the DAD Application: REDISTRIBUTION|TAX vs TRANSFER

  • After choosing the appropriate variable(s) and parameters, click on the  GRAPH button.

RESULTS

Since B2 is more progressive than T, a proportional increase in B2 financed by T makes the tax more progressive.

  • Inequality decreases;

  • Social welfare increases if it is sensitive to inequality;

  • Poverty decreases.