| Exercise 8.27 |
|
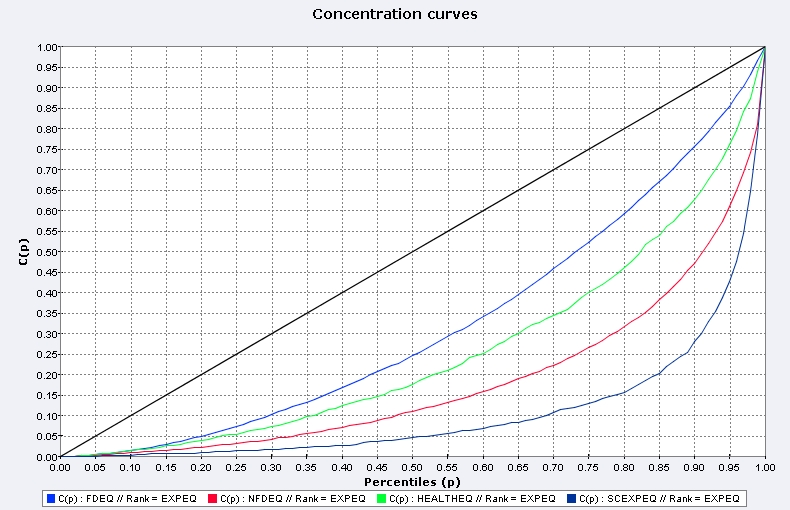
Draw the concentration curves of FDEQ, NFDEQ, HEALTHEQ and SCHEXPEQ for the population of individuals i.e., setting the size variable to SIZE) and using EXPEQ as the ranking variable. How do these curves compare to the Lorenz curve for EXPEQ? |
|
Answer |
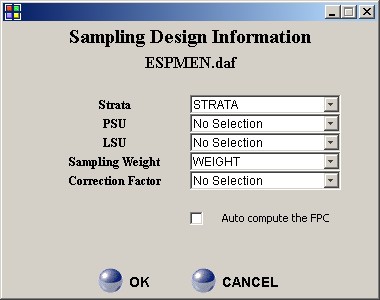
| STEP 1: Initialising the sampling weight: EDIT|Set Sample Design |
|
|
|
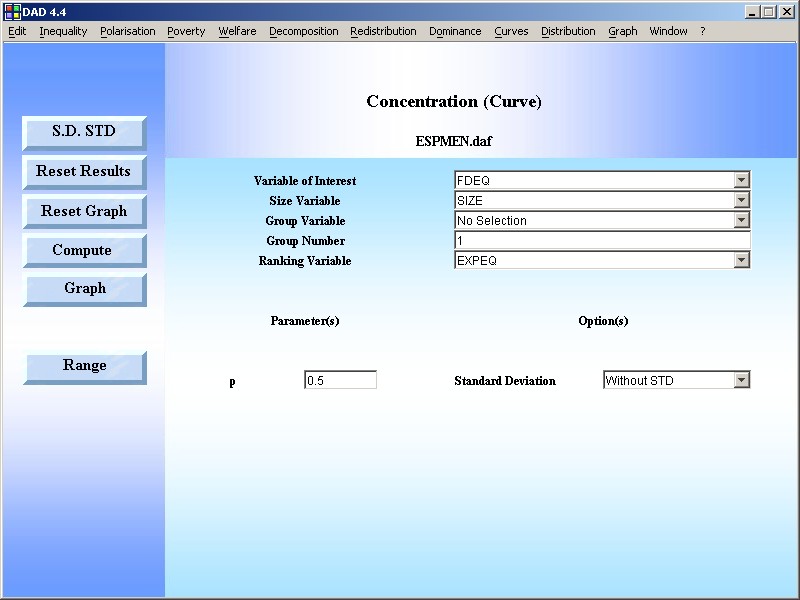
STEP 2: Use the DAD Application: CURVES|CONCENTRATION CURVE |
|
RESULTS |
|