| Exercise 8.3 |
|
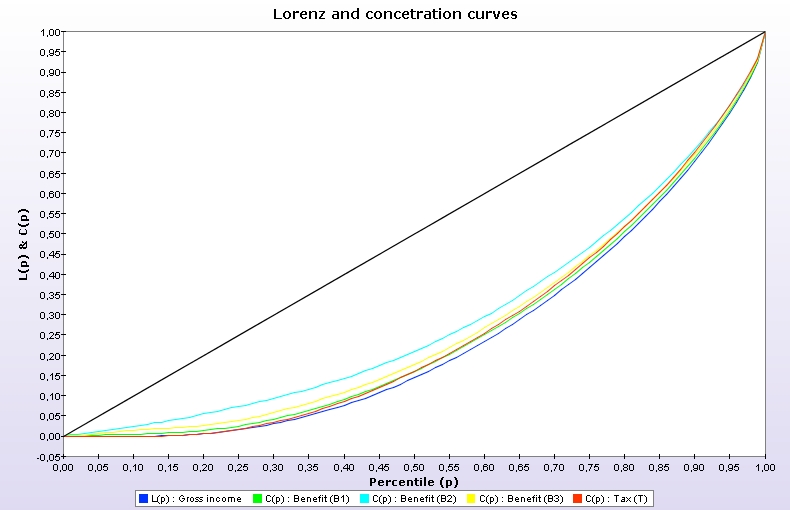
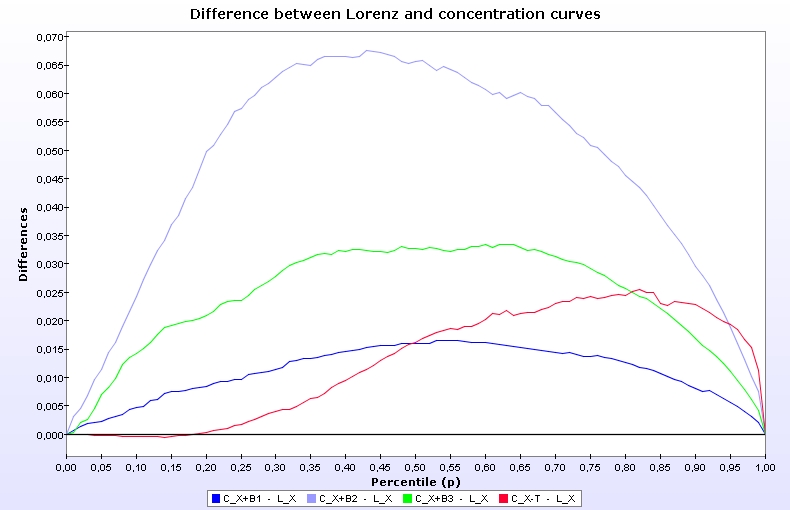
Use the same file CAN6 to check the IR progressivity of each of the three benefits and the tax T. For this, you can draw concentration curves for X combined separately with each of the three transfers B1, B2 and B3 and the tax T. What can you say about the IR progressivity and the "equity" of the distribution of the tax and benefits? How does it compare with the TR progressivity results?. |
|
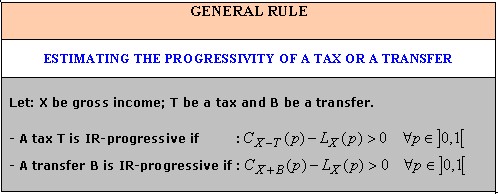
Answer To check the IR progressivity of a tax or a benefit, use the following rule:
|
|
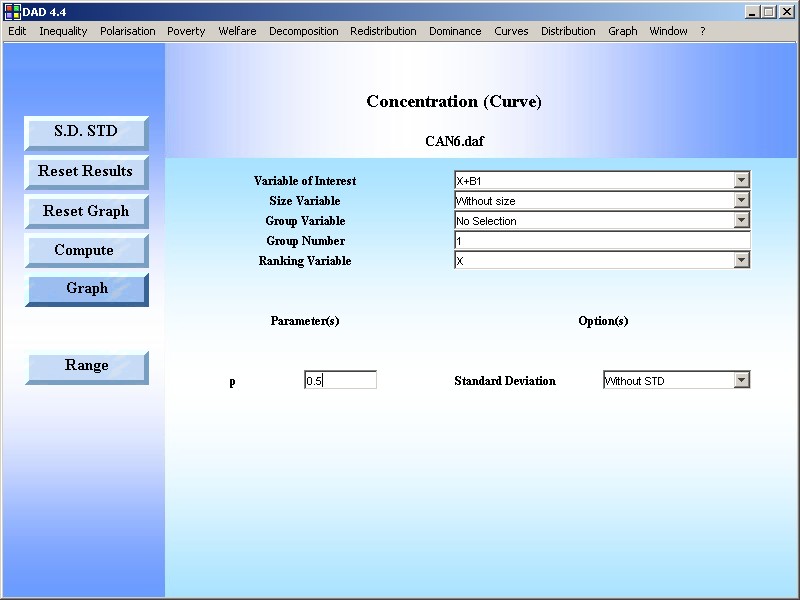
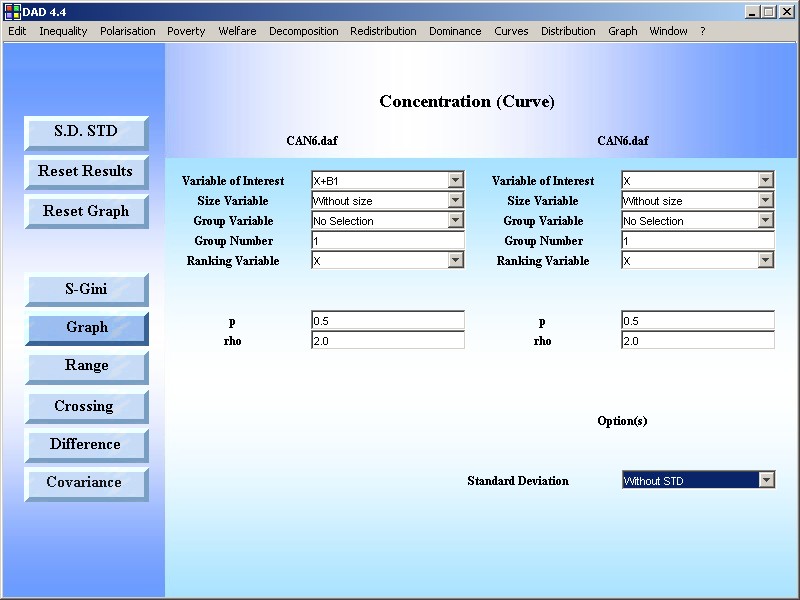
STEP 1: Generate vectors X-T, X+B1, X+B2 and X+B3. STEP 2: Draw the Lorenz curve for gross income X. STEP 3: Use the DAD Application: CURVES|CONCENTRATION CURVE |
|
RESULTS |
|