| Exercise 8.30 |
|
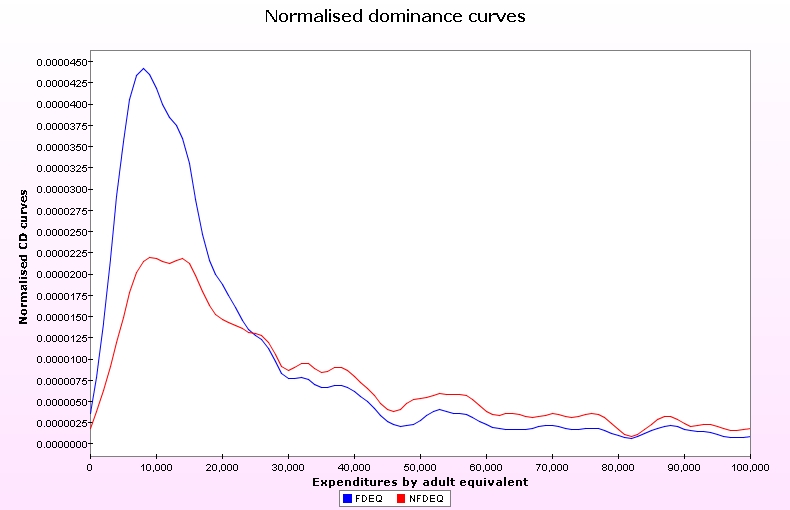
Draw the CD curve (normalized by the mean of the variables but not by the poverty lines) of FDEQ and NFDEQ for different poverty lines and for c=1. What does it tell you?. |
|
Answer |
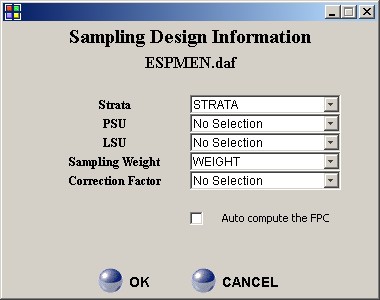
| STEP 1: Initialising the sampling weight: EDIT|Set Sample Design |
|
|
|
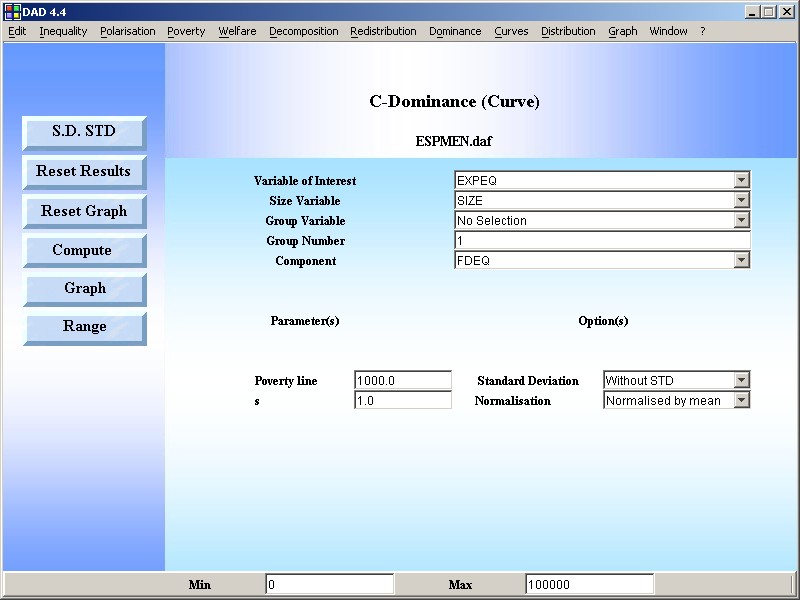
STEP 2: Use the DAD Application: CURVES|C-DOMINANCE |
|
RESULTS |
|
|