|
Exercise 8.31 |
|
Compute the Gini inequality index for TTEXP, EXPEQ and INCOMEQ. Do this
for values of r equal to 1, 2 and 3.
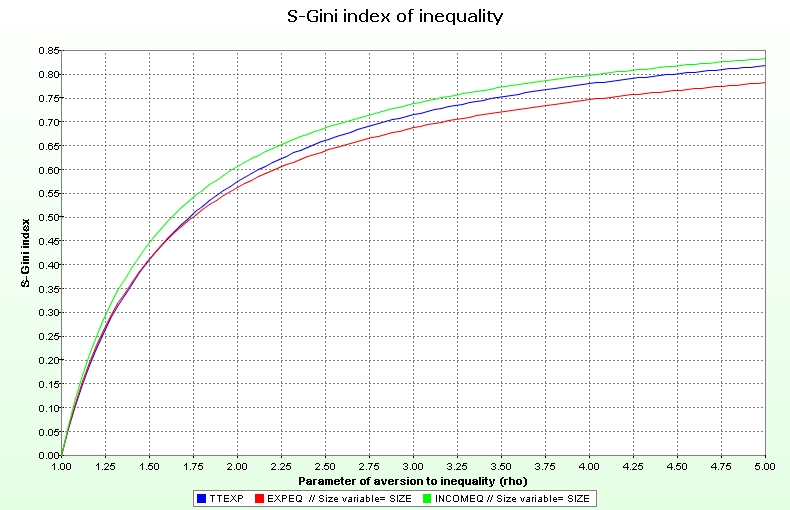
Then, draw these indices for each of these variables on a graph for
r ranging from 1 to 5. |
|
Answer |
|
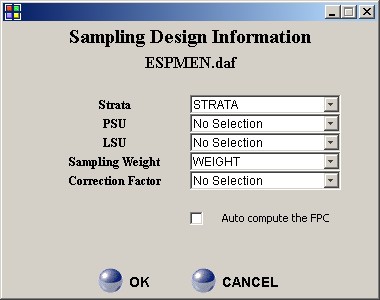
STEP 1:
Initialising the sampling weight: EDIT|Set
Sample Design |
|
|
|
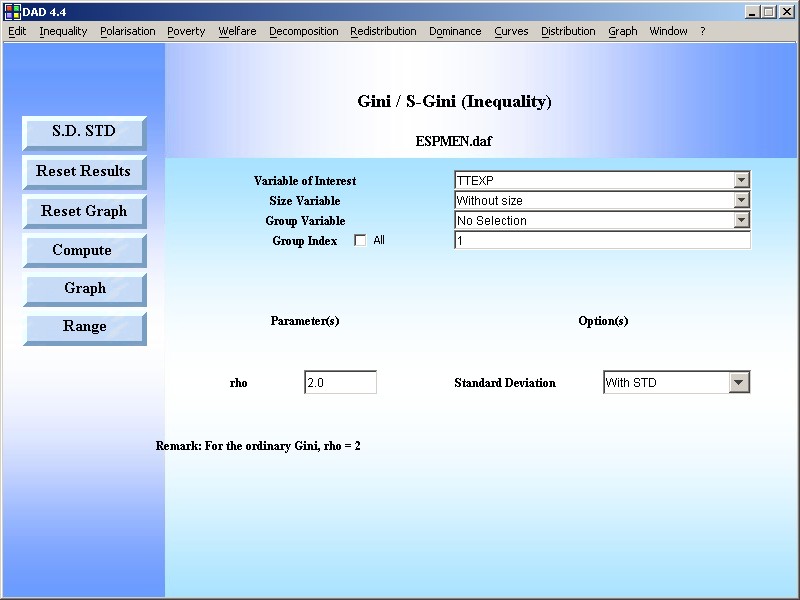
STEP
2: Use the DAD Application:
INEQUALITY|S-GINI |
|
RESULTS |
Gini / S-Gini (Inequality)
| Session Date |
Mon Aug 16 14:07:59 EDT 2004
|
| Execution Time |
0.156 sec
|
| FileName |
ESPMEN.daf
|
| OBS |
2000 |
| Sampling Weight |
WEIGHT |
| Variable of interest
|
TTEXP |
| Size variable |
Without size |
| Group variable |
No Selection |
| Group Number |
1 |
| Parameter |
ρ=2.0 |
Estimated value |
Standard deviation |
Lower bound |
Upper bound |
Confidence Level in (%) |
0.57371044 |
0.01013367 |
0.55384881 |
0.59357208 |
95.00000000 |
Gini / S-Gini (Inequality)
| Session Date |
Mon Aug 16 14:09:59 EDT 2004
|
| Execution Time |
0.125 sec |
| FileName |
ESPMEN.daf |
| OBS |
2000 |
| Sampling Weight |
WEIGHT |
| Variable of interest |
EXPEQ |
| Size variable |
SIZE |
| Group variable |
No Selection |
| Group Number |
1 |
| Parameter |
ρ=2.0 |
Estimated value |
Standard deviation |
Lower bound |
Upper bound |
Confidence Level in (%) |
0.56127267 |
0.01059287 |
0.54051103 |
0.58203431 |
95.00000000 |
Gini / S-Gini (Inequality)
| Session Date |
Mon Aug 16 14:11:15 EDT 2004
|
| Execution Time |
0.125 sec |
| FileName |
ESPMEN.daf |
| OBS |
2000 |
| Sampling Weight |
WEIGHT |
| Variable of interest |
INCOMEQ |
| Size variable |
SIZE |
| Group variable |
No Selection |
| Group Number |
1 |
| Parameter |
ρ=2.0 |
Estimated value |
Standard deviation |
Lower bound |
Upper bound |
Confidence Level in (%) |
0.60529713 |
0.00982893 |
0.58603278 |
0.62456147 |
95.00000000 |
|
|