| Exercise 8.8 |
|
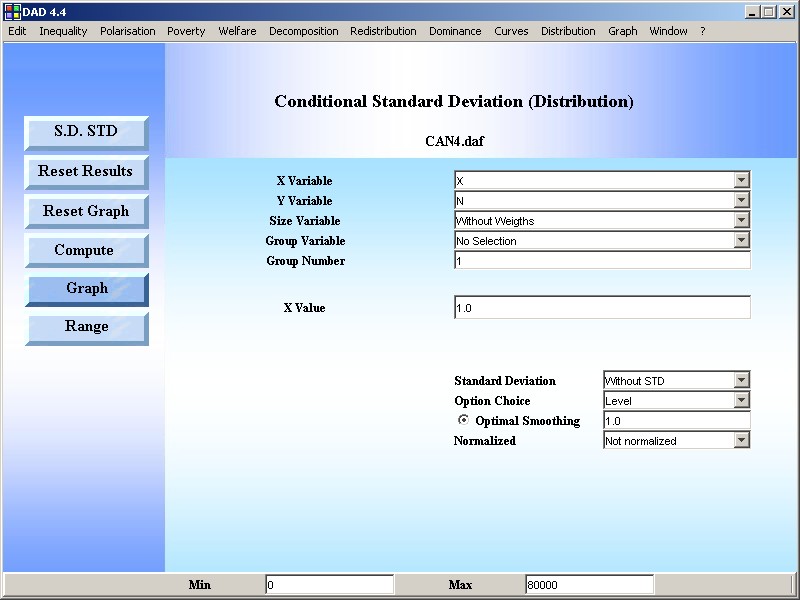
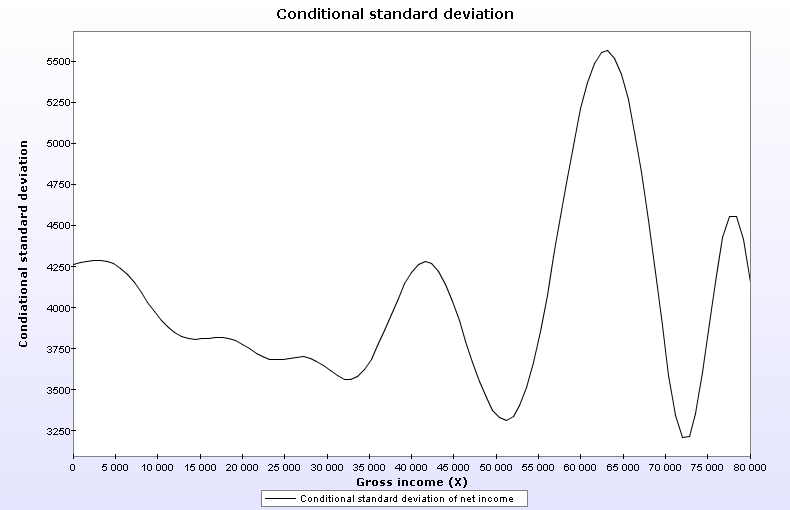
Draw the conditional standard deviation of benefits B and taxes T at various values of gross income X. |
|
Answer |
|
STEP 1: Use the DAD Application: DISTRIBUTION|CONDITIONAL STANDARD DEVIATION |
|
RESULTS |
|
|