Exercise 8.9

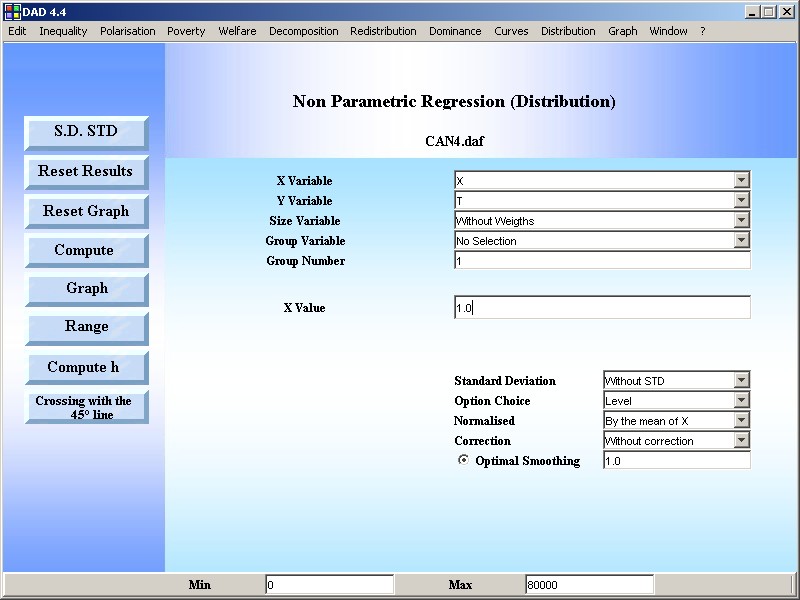
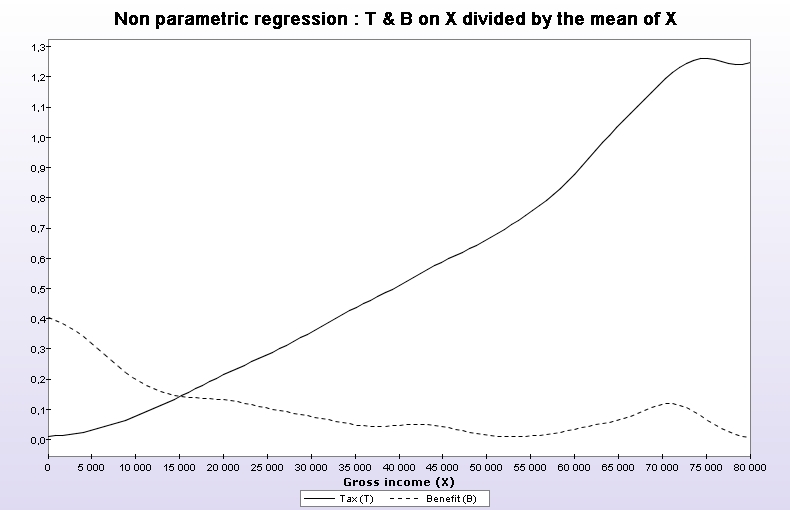
Draw the share of total taxes T paid by those at different levels of gross income X, and at different ranks of X. Compute this as
the ratio of expected taxes over mean gross income
mX. Do the same for total benefits B. Compare this to the share of total
gross income, computed as X over
mX. What does this say?.

Answer

STEP 1: Use the DAD Application: DISTRIBUTION|NON PARAMETRIC REGRESSION

  • After choosing the appropriate variable(s) and parameters, click on the  GRAPH button.

RESULTS


  • When Y axis =1, T(X)=m
  • Since TX>0, the tax T is progressive.
  • Since BX>0, the transfer B is regressive.