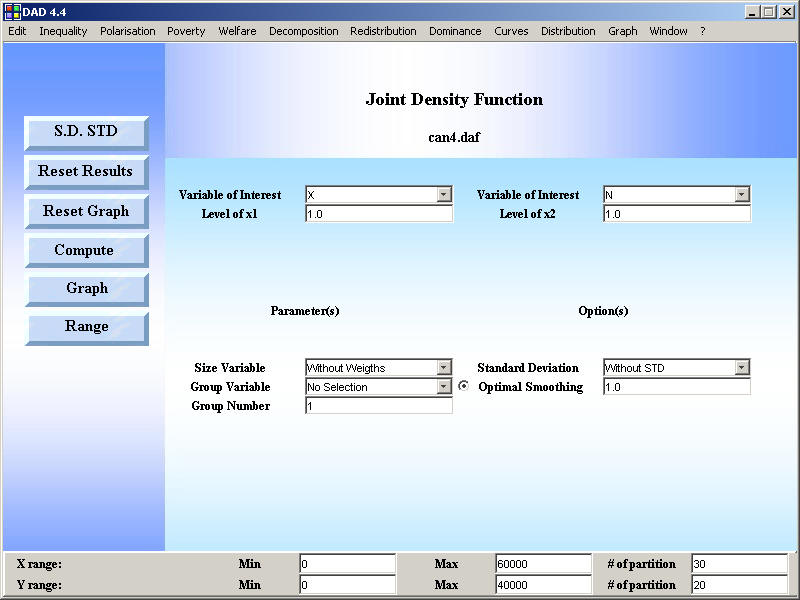
- min and max of x and y
- the number of partitions of x and y: example : if min_x=0, max_x=100, # of partions =5: we have the x values {0,20,40,60,80,100}
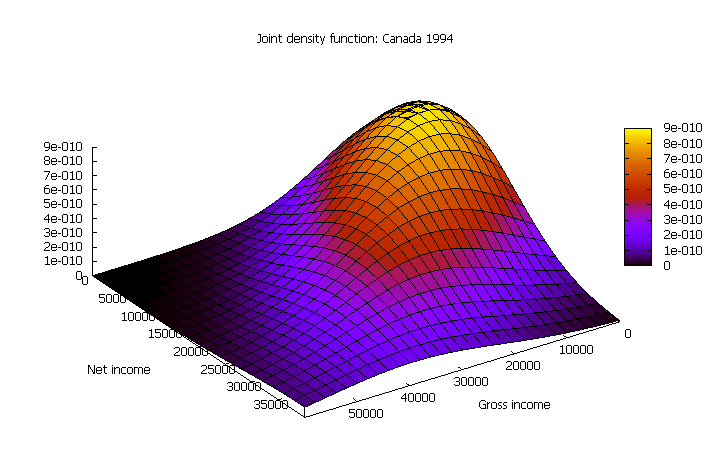
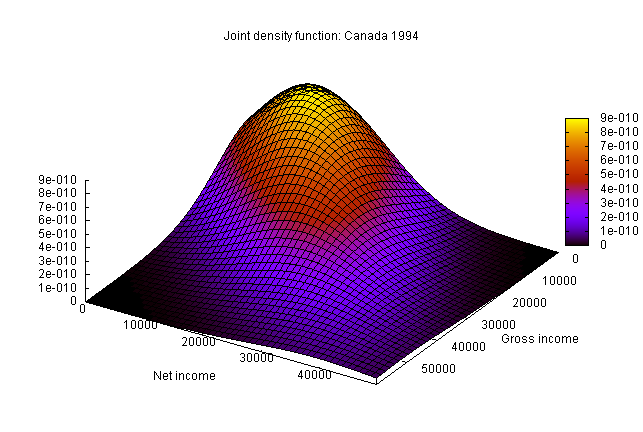
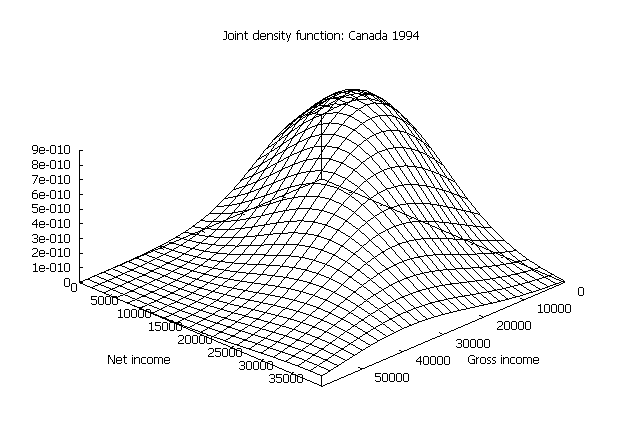
Plotting a joint density function using DAD and the free software GnuPlot
ASCII format
0.0 0.0 4.3596391219107303E-10
0.0 2000.0 5.163158311939581E-10
0.0 4000.0 5.891313258199563E-10
0.0 6000.0 6.476806317153927E-10
0.0 8000.0 6.86080129056403E-10
0.0 10000.0 7.002655982746375E-10
0.0 12000.0 6.88704414202037E-10
0.0 14000.0 6.526731803306815E-10
0.0 16000.0 5.960298892786326E-10
0.0 18000.0 5.245357512644426E-10
0.0 20000.0 4.4489129805950077E-10
0.0 22000.0 3.6371010005821217E-10
0.0 24000.0 2.8664615795719816E-10
0.0 26000.0 2.178262384684533E-10
0.0 28000.0 1.5964303084639936E-10
0.0 30000.0 1.1287221027596754E-10
0.0 32000.0 7.701275915731387E-11
0.0 34000.0 5.072690368766997E-11
0.0 36000.0 3.2269788845388605E-11
0.0 38000.0 1.983533648806619E-11
0.0 40000.0 1.1786781054602485E-11
2000.0 0.0 4.668565107490192E-10
2000.0 2000.0 5.556559994590353E-10
2000.0 4000.0 6.372835960909553E-10
2000.0 6000.0 7.043520426273741E-10
2000.0 8000.0 7.502371736355579E-10
2000.0 10000.0 7.70156910997408E-10
etc...
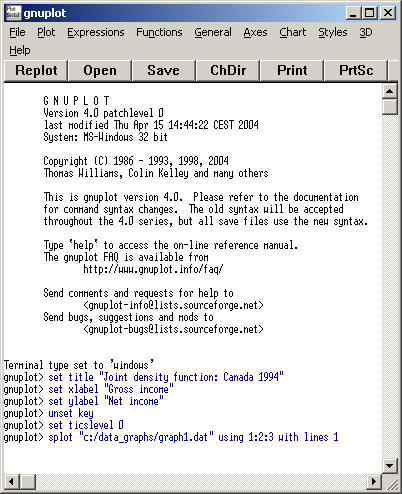
# To set the Graph title
set title "Joint density function: Canada 1994"
# To set the X axis title
set xlabel "Gross income"
# To set the Y title
set ylabel "Net axis income"
# No hide the legends
unset key
# To set the tocs level at 0
set ticslevel 0
# To plot the 3D graph
splot "c:/data_graphs/graph1.dat" using 1:2:3 with lines 1
# drawing with palette-mapped
set pm3d
splot "dat3d.dat" using 1:2:3 with lines 1
|
| Another example with a higher number of partitions |
|
Remarks :
|
|