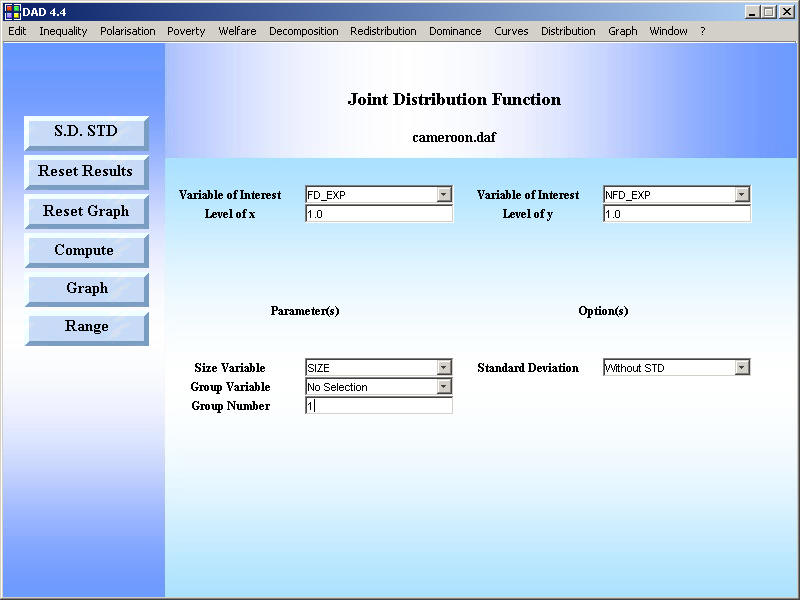
Plotting a joint distribution function using DAD and the free software GnuPlot
The two distributions are supposed to be dependent

# To set the Graph title
set title "Joint distribution function: Cameroon 1996"
# To set the X axis title
set xlabel "Food expenditures"
# To set the Y axis title
set ylabel "Non food expenditures"
# To set the z axis title
set zlabel "F(x,y)"
# No hide the legends
# unset key
# To set the tocs level at 0
set ticslevel 0
# To plot the 3D graph
splot "c:/data_graphs/graph2.dat" using 1:2:3 with lines 1
Other proposed commands
# To set the Graph title
set title "Joint distribution function: Cameroon 1996"
# To set the X axis title
set xlabel "Food expenditures"
# To set the Y axis title
set ylabel "Non food expenditures"
# To set the z axis title
set zlabel "F(x,y)"
# No hide the legends
# unset key
# To set the tocs level at 0
set ticslevel 0
# to set the view parameters
set view (50,312)
# to hide lines
set hidden3d
#drawing with palette-mapped
set pm3d
# To plot the 3D graph
splot "c:/data_graphs/graph2.dat" using 1:2:3 with lines 1
|
Remarks :
|