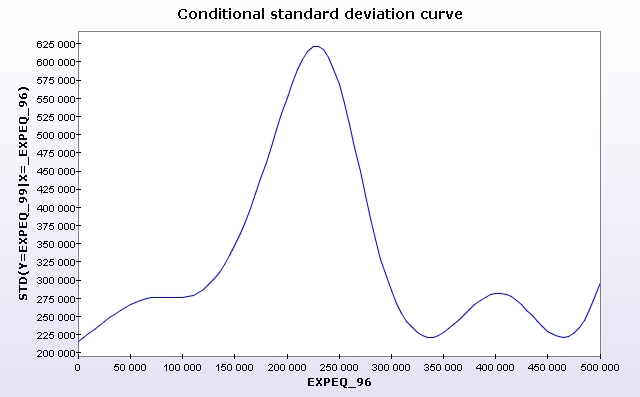
- according to the level of the initial period
The following figure shows a scatter plot of the beninese household expenditures for 1996 and 1999.
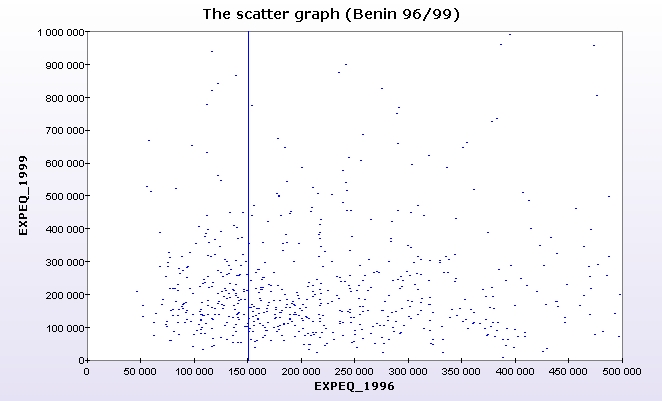
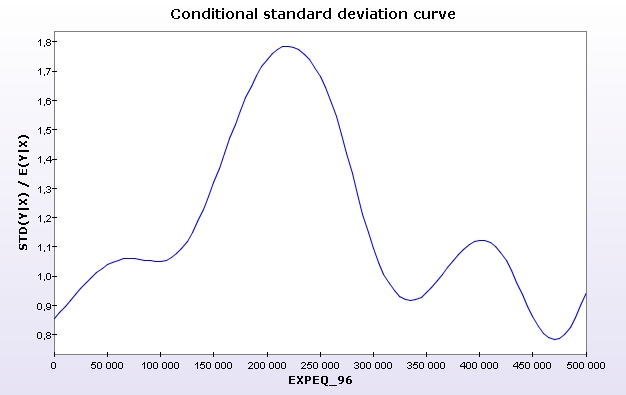
To show the conditional standard deviation of these expenditures:
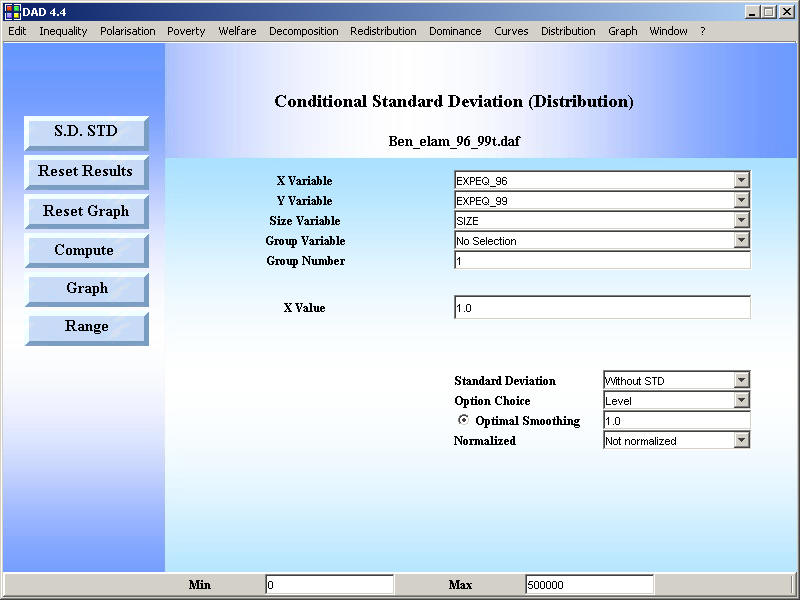
- Use DAD and launch the application Distribution => Conditional standard deviation.
- Select the appropriate vectors (X: Income in the initial period, Y: Income in the final period)
- Click on the button RANGE and choose the appropriate range (optional)
- Click on the button GRAPH
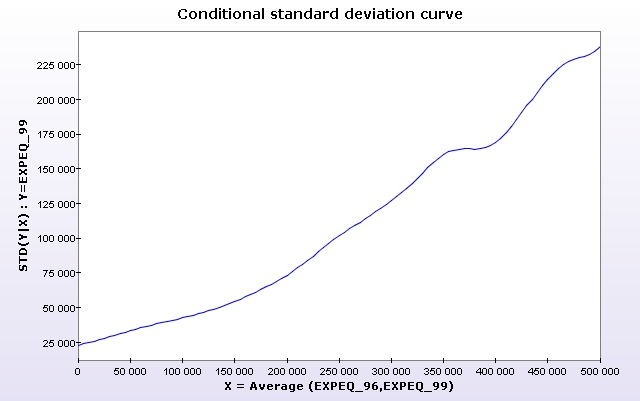
- according to the average income
Instead of initial income, one can use average income of the household across the two years.