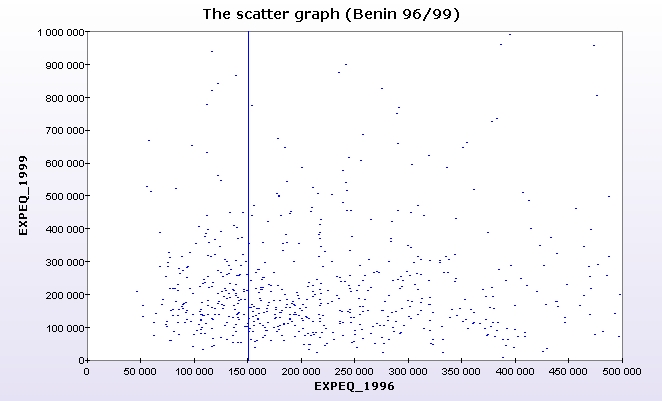
The following figure shows a scatter plot of household expenditures in Benin for 1996 and 1999.
-
The difference in the observed inequality between the two periods can be decomposed into vertical and horizontal inequality
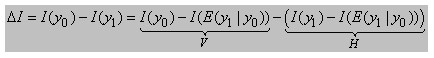
y0 : Vector of incomes of the initial period
y1 : Vector of incomes of the final period
E(y1|y0) : Vector of the expected incomes in the final period
One can then decompose the observed variation in poverty into vertical and horizontal components of inequality such that:
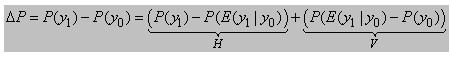
V component is the variation in poverty explained by vertical inequality
H component is the variation in poverty explained by horizontal inequality
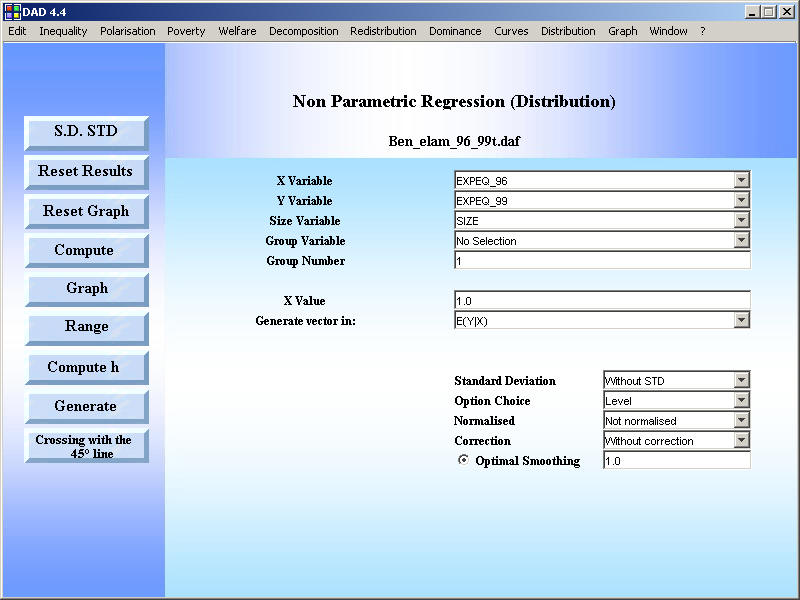
To compute all these components, we can use DAD to:
- Generate the vector E(y1|y0). For this:
- use the application : Distribution=> non parametric regression
- choose the appropriate vectors and parameters and click on the button GENERATE.
- Once that this vector is generated, one can use the application Poverty=FGT Index (with 2 distributions) to finalise the computation.