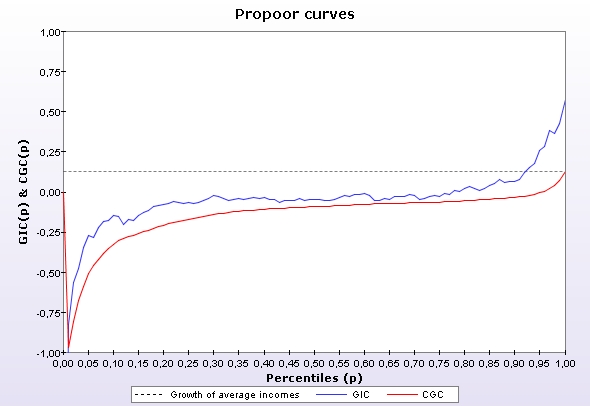
With DAD, one can draw the following pro-poor curves.
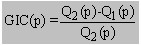
The Growth Incidence Curve (GIC):
Noting the quantile at percentile p by Q(p), this curve expresses the percentage change in Q(p) between two periods (1,2):
The Cumulative Growth Curve
(CGC)
Denoting the generalized Lorenz curve by GL(p), this curve expresses the percentage change in GL(p) between two periods (1,2):
![]()
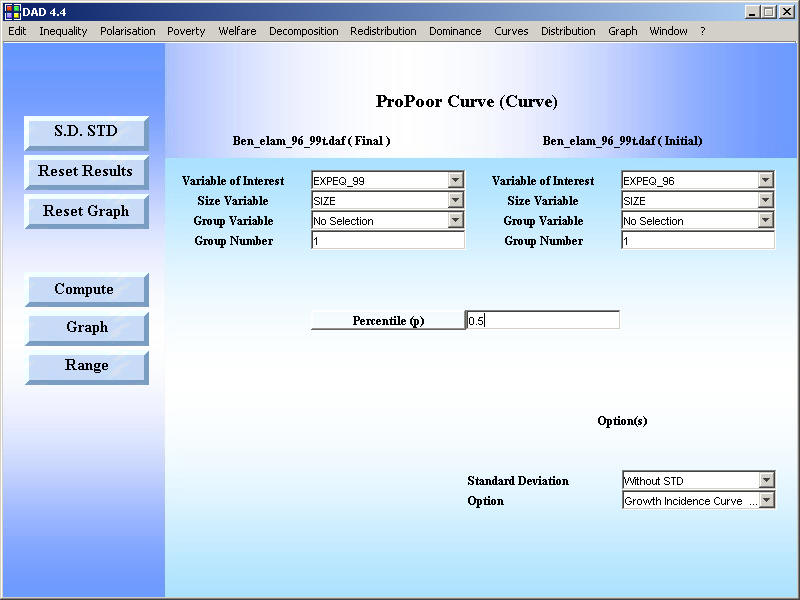
- From the main menu, choose the item: "Curves => Pro poor curve".
- Chose the order
- Choose the different vectors and parameter values.
Example