| Exercise 8.16 |
|
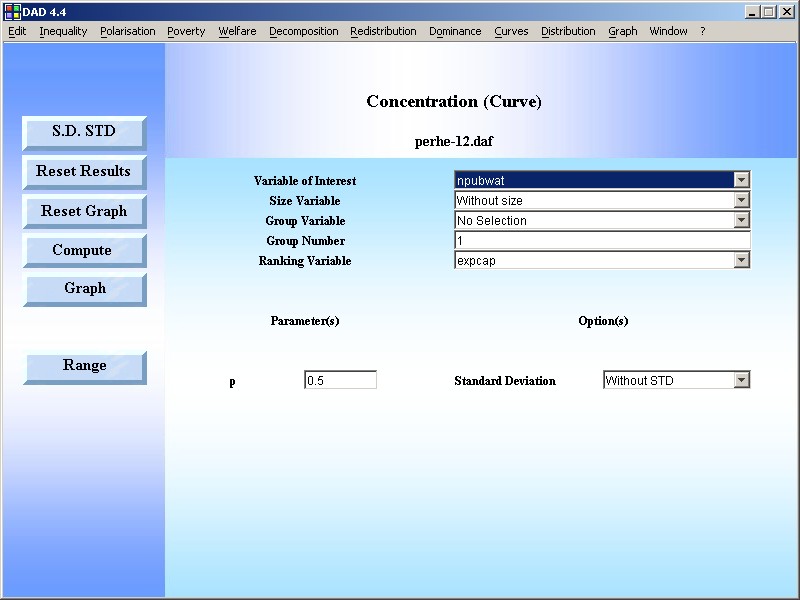
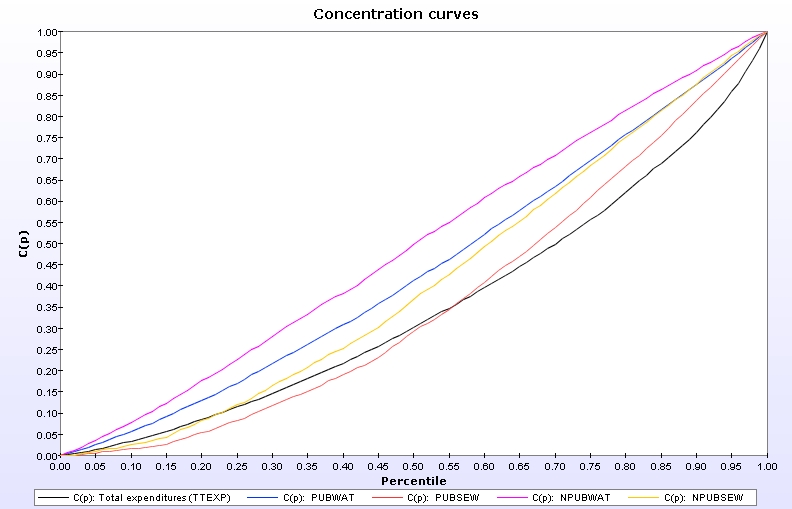
Add to your previous graph the concentration curves for the number of individuals who have piped water (NPUBWAT) and who have sewerage (NPUBSEW), using household weighting and EXPCAP as the ranking variable. How do you interpret the differences you obtain with the results of question 18.15? |
|
Answer |
|
STEP 1: Use the DAD Application: CURVES|CONCENTRATION CURVE |
|
RESULTS |
| |